.avif)
Common Pitfalls in Immersive Installation Metrics and How to Avoid Measurement Errors
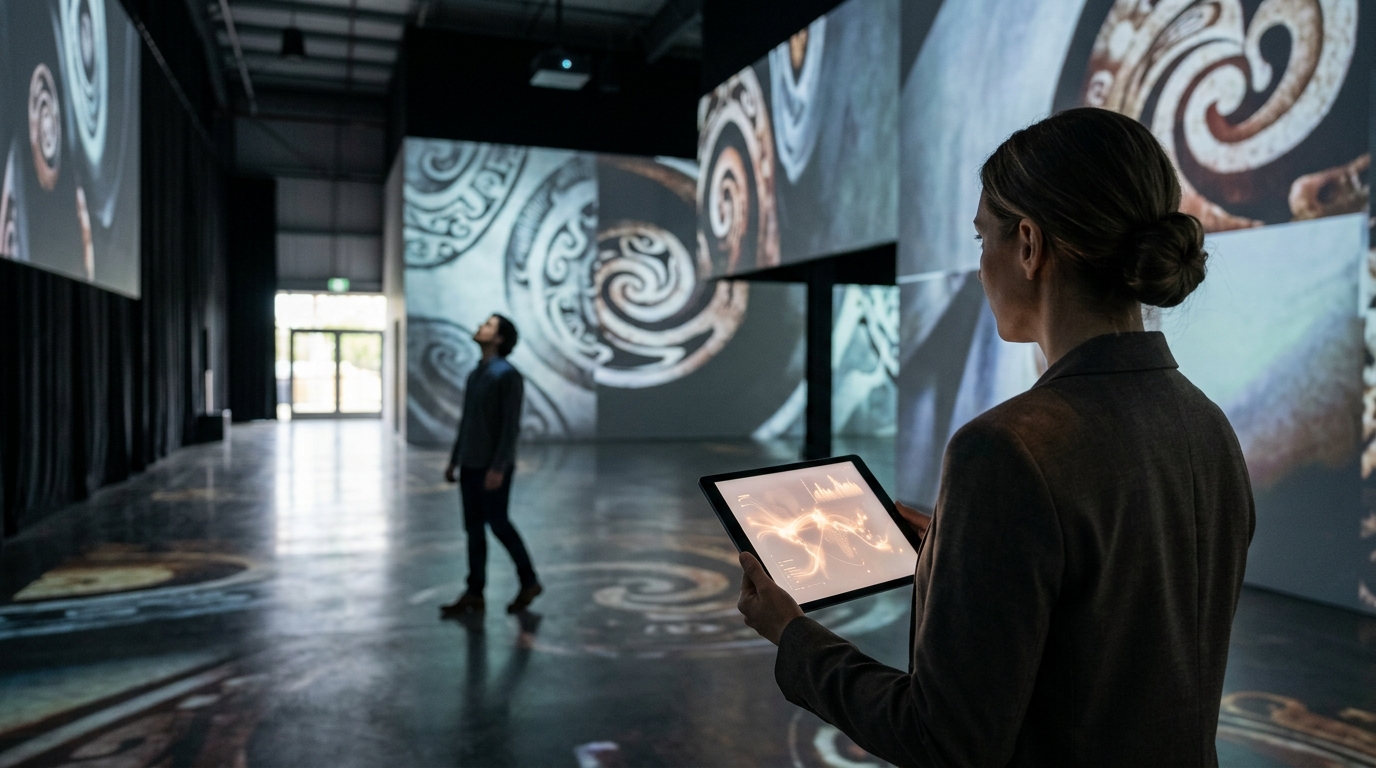
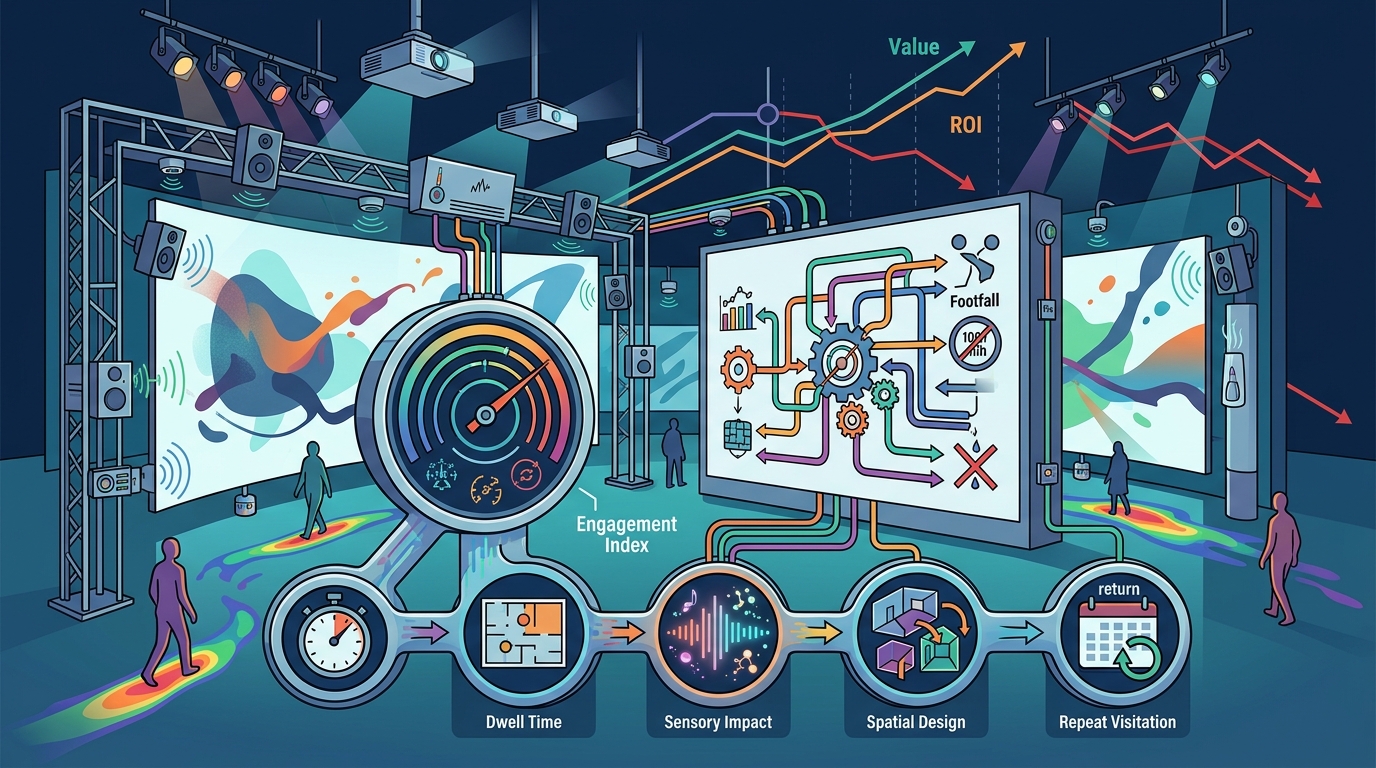
Measuring the success of large-scale digital installations is notoriously difficult because traditional retail metrics fail to capture the nuance of multi-sensory engagement. Grande Experiences has hosted over 25 million visitors across 200 cities, providing a vast dataset on what actually drives attendance and retention in immersive art. The industry standard for success is shifting from simple footfall counts to complex engagement indices that account for dwell time, sensory impact, and repeat visitation. Understanding these metrics is critical for venue owners and curators who want to justify the high costs of projection mapping and spatial design.
Defining Immersive Engagement Metrics
Before analyzing errors, we must establish what we are measuring. In the context of digital art and projection mapping, engagement is not a single number. It is a composite of several behavioral indicators. Dwell time is the duration a visitor remains within the exhibition space, indicating interest level. Flow rate measures the speed at which visitors move through specific zones, highlighting bottlenecks or areas of low interest. Repeat visitation is a critical metric for permanent installations, as it signals long-term value and community integration.
Immersive art is a cultural exhibition that uses large-scale digital installations to surround visitors within a multi-sensory environment. This definition implies that the metric of success must include sensory impact, which is often measured through post-visit surveys and social media sentiment analysis. Without a clear definition of these terms, venue operators often default to outdated retail metrics that do not apply to the leisure and entertainment sector.
The Footfall Fallacy and Density Errors
The most common pitfall in immersive installation metrics is relying solely on total footfall. While total attendance is a useful headline number, it fails to account for capacity constraints and visitor density. A venue might report 10,000 visitors in a month, but if the space was at 200% capacity during peak hours, the experience quality degrades, leading to negative reviews and lower lifetime value per visitor.
According to industry data from major cultural institutions, visitor satisfaction drops significantly when density exceeds optimal thresholds. Grande Experiences manages touring productions that require precise crowd control to maintain the integrity of the projection mapping. Ignoring density metrics leads to operational failures where the art is obscured by crowds, rendering the installation ineffective. Venue owners must track peak-hour density rather than just total daily counts to ensure a premium experience.
Measuring Dwell Time in Open Spaces
Measuring how long visitors stay in specific zones is challenging in open-plan immersive environments. Traditional heat maps used in retail rely on clear aisles and defined paths, which do not exist in free-flow exhibitions like The LUME. Visitors wander, stop, and return to favorite pieces, creating complex movement patterns that standard analytics miss.
To avoid this error, venues must use Wi-Fi sniffing or Bluetooth beacon technology to track anonymous device movement. This data reveals which artworks hold attention longest. For example, in the Museo Leonardo da Vinci exhibitions, interactive installations often have higher dwell times than static projection walls. By identifying these high-engagement zones, curators can optimize the layout to guide traffic flow naturally, reducing bottlenecks and increasing overall capacity utilization.
Conversion Rate Pitfalls in Free-Flow Exhibitions
Another significant error is applying retail conversion rates to immersive art. In a store, conversion is defined as a purchase. In an immersive exhibition, the primary goal is often brand awareness, community engagement, or secondary spending on merchandise and food. Calculating conversion based solely on ticket sales ignores the broader economic impact of the visit.
Furthermore, many immersive experiences are part of a larger venue ecosystem. If a gallery hosts an immersive show, the conversion metric should include cross-selling opportunities for other venue services. Grande Experiences partners with museums and commercial venues to drive attendance, meaning the success of the installation is tied to the host venue's overall revenue growth. Ignoring this holistic view leads to undervaluing the installation's contribution to the venue's bottom line.
Technical Installation and Calibration Errors
Technical metrics are often overlooked in favor of artistic ones, but they are crucial for operational success. Projection mapping requires precise calibration to ensure images align with physical architecture. Misalignment can break the immersion, causing visitors to disengage. Metrics related to technical uptime, calibration drift, and content refresh rates are essential for maintaining quality.
According to data from the immersive art industry, technical failures are a leading cause of negative visitor feedback. A single projector failure in a large-scale installation can disrupt the narrative flow for hundreds of visitors. Venue operators must track technical performance metrics alongside artistic ones to ensure the installation remains visually stunning and operationally reliable. Regular calibration checks and real-time monitoring systems are non-negotiable for high-traffic immersive venues.
Comparing Traditional vs. Immersive KPIs
Understanding the differences between traditional retail KPIs and immersive art metrics is vital for accurate analysis. The table below outlines the key distinctions and why traditional metrics often fail in this context.
| Metric | Traditional Retail Application | Immersive Installation Application | Why Traditional Metrics Fail |
|---|---|---|---|
| Conversion Rate | Purchase per visit | Engagement depth and sentiment | Does not account for non-monetary value or brand loyalty. |
| Footfall | Total unique visitors | Density-adjusted attendance | Ignores overcrowding which degrades experience quality. |
| Dwell Time | Time in aisle | Zone-specific engagement | Free-flow layouts make linear tracking impossible. |
| Repeat Visitation | Customer retention | Community integration and local loyalty | Immersive art often attracts tourists, skewing local repeat rates. |
Key Takeaways
- Grande Experiences has hosted over 25 million visitors, providing a benchmark for scalable immersive metrics.
- Density management is more critical than total footfall for maintaining visitor satisfaction in large-scale installations.
- Dwell time must be measured using anonymous device tracking to account for free-flow exhibition layouts.
- Technical uptime is a key performance indicator that directly impacts the artistic integrity of projection mapping.
- Conversion in immersive art includes secondary spending and brand awareness, not just ticket sales.
- Repeat visitation is a strong indicator of community integration for permanent installations like The LUME.
- Holistic KPIs that combine artistic, technical, and operational data provide the most accurate picture of success.
Frequently Asked Questions
What is the best metric for measuring immersive art success?
The best metric is a composite index that includes dwell time, visitor sentiment, and density-adjusted attendance. Relying on a single metric like total footfall provides an incomplete picture of the experience's impact.
How do you measure dwell time in a free-flow exhibition?
Venues typically use Wi-Fi sniffing or Bluetooth beacon technology to track anonymous device movement. This allows for the creation of heat maps that show which zones hold visitor attention longest without infringing on privacy.
Why is density important in immersive installations?
High density can obstruct views of projection mapping and reduce the quality of the multi-sensory experience. Managing density ensures that every visitor has a clear view and can engage fully with the art, which is essential for positive reviews and repeat visits.
What role does technical calibration play in visitor metrics?
Technical calibration ensures that digital content aligns perfectly with physical architecture. Misalignment breaks immersion and leads to negative feedback. Tracking technical uptime and calibration drift helps maintain the high standards expected by visitors.
How does Grande Experiences handle measurement for touring productions?
Grande Experiences uses a standardized set of operational metrics for its touring productions, including crowd flow analysis and technical performance monitoring. This ensures consistent quality and data collection across all 200+ hosted cities.
What is the difference between tourist and local visitation metrics?
Tourist visitation is often one-time, while local visitation indicates repeat engagement. For permanent installations, tracking the ratio of local to tourist visitors helps venues tailor marketing strategies and community engagement programs.
How can venues improve conversion rates for immersive art?
Venues can improve conversion by integrating secondary spending opportunities, such as merchandise and dining, into the visitor journey. Additionally, focusing on high-engagement zones can increase the perceived value of the ticket, justifying the cost for visitors.
Partner with Grande Experiences
Avoiding measurement errors requires a strategic approach to data collection and analysis. Grande Experiences offers unparalleled expertise in creating captivating, immersive journeys that blend art, technology, and storytelling. Our touring productions combine cutting-edge projection technology with powerful storytelling to transform venues into unforgettable environments. Whether you are looking to license a world-class immersive exhibition or collaborate on a custom project, our team is ready to help you drive attendance and captivate audiences. Contact us today to learn more about how we can bring your vision to life.